

There’s an excellent book called “The 4 Disciplines of Execution”. Even though it is dense, it is an EXCELLENT method of implementing effective change in an organisation.
One of the 4 Disciplines is to “Create a compelling score card”.
When it comes to Google Analytics, or financial data there is almost infinite data. You could lose (waste) days and days just looking at it all.
Based on creating a score card, it is about narrowing your focus to just a few numbers. Ideally related to action steps, or lead measures. For example, the lag measure is, “how many people visited my website last month?”. But you can’t take action on that. The lead measure, for a scorecard, might be, “how many blogs did I post last month?”.
Simplify your numbers and create a scorecard. Look at it regularly. Watch the trends over several months. Regardless of what you choose to focus on, I’m certain your business numbers will improve overall.
You may have heard of the research done to see which type of lighting improved performance? Both the control group and the test group improved! Because people responded positively to being measured.
My brother in law is a very effective soccer coach. Whenever he joins a local team to play, it isn’t long before he is coaching the team or maybe some of the other age groups. One of the tactcs I have seen him use is to give everyone an individual goal or two. Helping them to focus. Maybe a certain number of cross passes, or only letting 3 people past you in a single half, for example.
That simple focus on small numbers gets great results, and team performance lifts each game.
A common question I get asked when a client and I start looking at their Google Analytics data: “are these numbers good or bad?”, “what is normal for a small business?”.
And from that I have learned that you need to know your numbers over time. Rather than a snapshot, it is about the trend. The movement of the numbers over time, from month to month over a year.
And it is the same with Financial Numbers. It’s so beneficial to get in the habit of viewing your numbers. And being excited when simple actions improve them!
So tonight I want to tell you about a new financial scoreboard.
It is a website app created by someone here on the Central Coast. In fact, one of our LinkedIn Local regulars. And I’m telling you about it tonight because it is a simple, compelling scoreboard. And it is free!
The My Jazoodle App connects with you Xero, MYOB or Quickbooks to import and visually display your financial data in a way that is easy to interpret, and really fun to compare month on month and year on year.
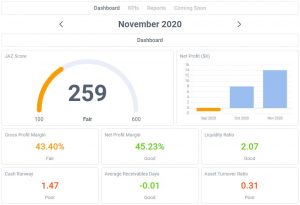
In the example above you can see the initial summary. And over time you will watch those numbers change based on your lead measures. For example, number of phone calls to overdue invoices. And then watch the impact on the Average Receivables Days.
Narrow your focus to just a few numbers, and watch the impact on your performance. It’s a great tool. It is free. (There are paid additions, but this is not a free trial, just a free scoreboard.)
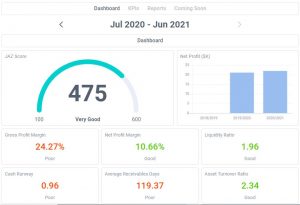
What is the JAZ score? What should my business have? I can’t tell you what is a good score for you, only that it is fun to watch it improve over time!
You can connect to Jazoodle here: https://my.jazoodle.app/
Happy scoring!